|
||||
| Sea Technology Article: Drinking from the Fire-Hose | ||||
| By: Tom Reed, president of Oceanic Imaging
Consultants, Inc., Seafloor mapping - while admittedly potentially a complex, detail-intensive task involving numerous electronic sensors, telemetry systems and logging/display devices - can be, and often is best thought of, as making pictures of the bottom of the sea. Pictures, as we all know, contain a lot of information. A typical 35mm color slide, at 9000 scan lines per inch and approximately a 4x3 aspect ratio, contains over 2.5 Giga-bits of information. Clearly, mapping the seafloor can be highly data-intensive, resulting in data overload on both operators and logging devices. "The Matrix" notwithstanding, people do not deal gracefully with scrolling alpha-numeric byte-streams. Scrolling pictorial representations (waterfalls, graphic recorders, etc.) are the usual solution, but often with compression in both physical resolution, and data dynamic range. With recording mimicking display, loss of resolution, or reduction in survey coverage and pace, was considered inevitable. These mandatory losses are now a thing of the past. Sustainable, 24-7-365 reliable logging and real-time processing of seabed mapping data at rates in excess of 10 mega-bytes per second is available in commercial, off the shelf PC-based packages today. HISTORICAL PERSPECTIVE A typical two-channel analog sidescan system actually provides a large amount of information. Fortunately, roll-paper records are quite efficient at gathering this, albeit somewhat difficult to carry around in significant quantities. When taken to the digital domain, a quantitative notion of the data available to us becomes apparent. Assume a reasonable digitization rate of 24 KHz, yielding a constant slant-range resolution of 3 centimeters. Assume 16-bits sample resolution to encompass the likely range of raw backscatter variations in amplitude. This implies a data rate from a simple two-channel sidescan of approximately 100 Kbytes per second, or 360 megabytes per hour. This will fill a Zip-disk in 15 minutes, and a 1 GB Optical platter in under 3 hours. To people planning a 30 day cruise, this begins to look expensive. In steps downsampling. Perception is everything, they say. A high-quality roll-paper recorder can display 4096 samples across a scan, and you don't need to hire a programmer to show your boss the data. For the typical sidescan mentioned above, this would allow you to show full resolution data for any swath of 50 meters range or less. At any range greater than that, you would have to throw away some of the data. At 100 meter range, you would have to throw away half the data, for example. Furthermore, the human eye can only distinguish between 16 and 32 shades of grey. This translates to retaining at best one third of the original dynamic range. If you take this same data to an XGA computer monitor, you are limited to only 1024 samples across a line, and a depth resolution of 8-bits. Let's assume you may have 2 screens, so now, in theory, you would need to log only 1024 samples per side, 8-bits per sample to make maximum use of your digital display system. If you operate at 100 meters range or greater, and only log what you display, you have irretrievably discarded over 75% of your data. No amount of post-acquisition signal processing magic can bring this lost data back. Furthermore, any operator-induced changes to gains, contrast stretches, etc. are likely to be permanent. Logging raw data at full resolution and full dynamic range obviates these problems. It just requires media space, and through-put bandwidth. NEW DEVELOPMENTS |
||||
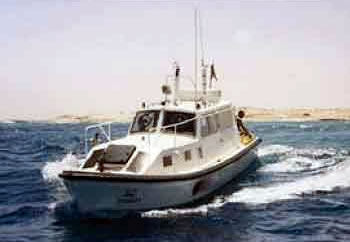 Figure 1. NAVOCEANO Hydrographic survey launch (34' LOA). |
||||
| Oceanic Imaging Consultants (OIC) was selected to provide
GeoDAS as the Sonar Data Acquisition and Processing workstation for
the T-AGS ships and HSL's, interfacing to the Datasonics SIS1502 Dual-frequency
sidescan, as well as the Simrad EM3000 for multibeam bathymetry and
backscatter. The rack-mount GeoDAS workstation, as shown below, was delivered with dual 1280x1024 monitors, dual 18-GB hard-drives, and dual 20 GB Exabyte Mammoth tape drives. A quad-port Ethernet card allows simultaneous receipt of both the broadcast Simrad multibeam bathymetry and TSS-PosMV navigation and motion sensor data, as well as re-broadcast of processed OIC records of merged sidescan and bathymetry to client workstations, either on the launch, or at a remote location, via Ethernet Radio Link. The latter technique allows observers back on the host T-AGS ship or land to view raw or processed data from the HSLs as the data are being acquired, offering both immediacy of analysis, and easy remote trouble-shooting of any data quality issues which might arise. |
||||
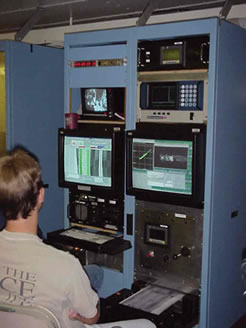 Figure 2. GeoDAS equipment rack aboard NAVOCEANO ship, with dual 1280x1024 monitors, rack-mount keyboard, CPU, Sonar MUX and printer, plus integrated winch controls, USBL tracking unit & deck cameras. |
||||
| The sidescan on the HSL's is a Datasonics SIS1501/2
dual-frequency system. The 1501 model indicates CW technology, while
the 1502 indicates that the sonar can operate in both CW and Chirp
mode. GeoDAS interfaces to and controls the SIS1501/2 through the
through the Datasonics multiplexor and proprietary.dll, which allows
full control of sonar range, wet-gains, pulse type, length and power,
as also provide both sensor telemetry and a continuous 192 Kbytes
per second data feed. GeoDAS logs all this data raw, without any filtering
or downsampling, and then applies user-specified processing to allow
realtime data display in a variety of views (profile, waterfall, mosaic). The multibeam on the HSL's is the Simrad EM3000s, a 300 KHz sounder which provides 127 beams over a swath of upto 200 meters or four times water-depth, in waters from 0.5 to 150 meters deep. The system outputs both raw and corrected bathymetrye datagrams over a 10 Mb/sec UDP link. It can also broadcast both beam amplitude (average backscatter per beam) and the raw time-series backscatter data at full resolution (3 cm). GeoDAS catches all these datagrams and logs them in parallel with the SIS1501 sidescan data, and offers the user options for both processing and display selection. By default, the console will present a waterfall showing platform and sidescan attitude, course, etc., along with synchronized color-contoured bathymetry, and either low or high-frequency sidescan. The user may modify views and processing on the fly without interrupting data logging, to optimize onboard analysis such as target detection and survey status. |
||||
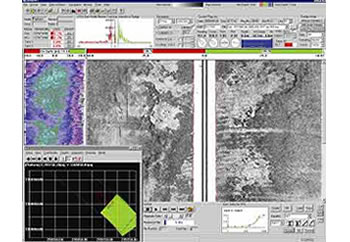 Figure 3. GeoDAS user interface, showing color-contour bathymetry in parallel with sidescan (100 or 500 KHz). |
||||
| The combined data streams from the sidescan and multibeam comes to just under 1 GB per hour, which GeoDAS logs continually to dual Exabyte 8900 tape drives, and optionally prints to a rack-mounted roll-paper recorder. The operators may also elect to create realtime mosaics of both the sidescan and bathymetry data, in a variety of projections, at user-definable scale and orientation. The geo-coded mosaics can be export to an on-board GIS package, and merged with existing data for quick-look mission products. | ||||
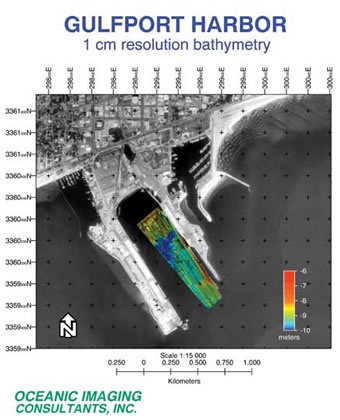 Figure 4. "Quick-look" mission product created from HSL bathymetry and sidescan, mosaicked at 1 centimeter resolution and merged with available air-photo data for the surrounding region. |
||||
DOUBLE OR NOTHING... GeoDAS-LLS provides a complete control, processing and display interface to the laser linescan system, treating the data stream as a single-channel sidescan (albeit, a VERY FAST sidescan). This includes full resolution raw data logging, as well as realtime and post-acquisition processing, targeting and geo-coding. The laser data can even be merged with co-registered sidescan data, to provide an ultra-high resolution "gap-filler" directly beneath the track of the sonar. Co-registration of sidescan and laser imagery provides significant improvements for search and recovery, bottom characterization and mine-hunting operations, with the laser data offering the potential of on-the-fly target identification, augmenting the sonar's extended abilities for target detection. |
||||
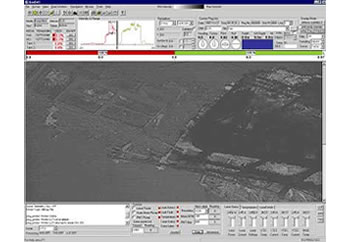 Figure 5. GeoDAS-LLS, showing data from the Raytheon LS-4096. |
||||
| NOT JUST ANOTHER PRETTY PICTURE... This spring, OIC completed it's modifications to GeoDAS to support Electronic Still Camera imaging. The completed interface retains the "look-and-feel" of the orginal GeoDAS user interface, while allowing continuous acquistion, processing and display of single or dual camera imagery, at data rates up to 10 MB per second. The interface supports multiple modes of display, including scrolling, binocular and single image view, to accommodate images up to 1280 by 1280 pixels on a side, at 16-bits dynamic range. A dual camera configuration at one Hertz frame rate in continuous operation mode will fill a 60 GB 8-mm tape in just over 2 hours. Dual tape-drives allow automatic roll-over, for uninterrupted logging (provided you brought A LOT of tapes...). Retaining the basic GeoDAS format while accommodating data records easily 1000 times more than your average sidescan record proved challenging, but the result provides the same processing, targeting, logging and QA/QC interface as available for scan-line based systems, minimizing operator re-training, and maximizing product reliability. |
||||
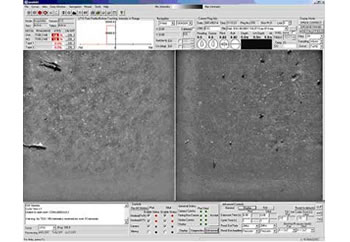 Figure 6. GeoDAS-ESC, in the dual-camera configuration. |
||||
DATA INTEGRATION ROVer's Eye, a real-time terrain visualization package developed by OIC under DARPA funding, provides one option. ROVer integrates a hi-speed 3-D rendering package with GeoDAS's realtime-processing and target analysis package, to provide an interactive immersive experience, wherein underwater vehicle operators can work not only with existing models, but see new data from on-board sensors evolve into the current model in realtime. ROVer accommodates simultaneous inputs from sidescan, bathymetry and navigation systems, while accessing a database of existing data, targets and as-built structure models. Operators see new data evolve in a model before them, just as headlights reveal the road ahead to night-time drivers. "Road-signs" in ROVer reveal not gratuitous advertising (nor Burma Shave ditties) but full resolution images of proximal targets, which "pop-up" as the vehicle passes by. The combination of synoptic swath data with detail-rich target imagery in a fully geo-coded environment provides a whole new level of data interpretation experience. |
||||
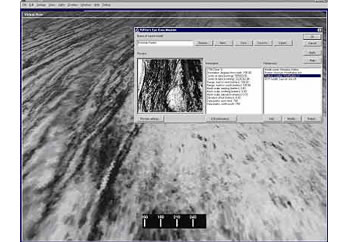 Figure 7. ROVer's Eye view of the bottom of Honolulu Harbor, with TargetView mode on, providing automatic notification of proximity of previously marked targets. |
||||
| SUMMARY Seafloor imaging is a data-intensive process. Down-sampling strategies compromise both image resolution and quantitative information potential. GeoDAS, an off-the-shelf solution for acoustic and non-acoustic seabed data acquisition and processing, can provide a uniform interface to sonar, laser and camera-based imaging systems, handling raw data rates up to 10 MB per second with no down-sampling losses, while retaining realtime interactivity. Examples are provided from working installations. |
||||
 Dr. Thomas B. Reed IV is founder and president of Oceanic Imaging Consultants, Inc. of Honolulu, HI. He received his undergraduate education from Harvard University in 1982, where he majored in Economic Geology, and completed his graduate work in Marine Geology and Geophysics at Hawaii Institute of Geophysics, in 1987. |