© 2013 Oceanic Imaging Consultants, Inc.

Service + Software for Seafloor Mapping

Some of the better-known multi-beam systems out there today are Odom, Reson 8101, Reson 9001, Seabeam, HydroSweep, Simrad-EM1000, and the Japanese MBES (multi-beam echo sounder). For reasons of convenience, multibeam systems are traditionally mounted on the hull of the vessel, and hence do better on calm days. While they are stabilized for ship motion, when the boat bangs around a lot, it tends to put both bubbles and noise in the water, which doesn't help the multibeam system. OIC works with data from all of these systems, and we have developed our own set of routines for processing both bathymetry and backscatter to minimize noise and other spurious data.
SIDESCAN
The second main type of marine survey device is a sidescan sonar, which, as the name implies, scan out to the side (this stuff isn’t that hard is it?), illuminating a bowtie shaped area of the seafloor with each ping. Within this group, there are two sub-groups: sidescan-only systems, which only produce acoustic images of the seafloor; and bathymetric sidescan sonars, which create both bathymetry and sidescan. At OIC, we work with both sidescan and multibeam sonars.
Sidescan sonars produce images of the seafloor and the objects on it. They do this by continuously pinging and recording backscattered echoes as a function of time and stacking the echo traces to make images. Strong reflectors are traditionally plotted as dark, and shadows as light. If the raw echo time series is plotted with time increasing on the x-axis and ping number increasing on the y-axis, we have what we call raw, uncorrected or “slant-range” imagery. (See Figure 5.)
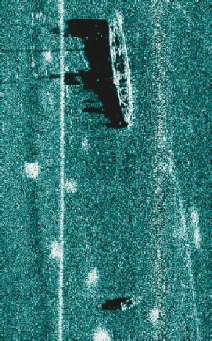
Since the x-axis is travel-time, and the y-axis is distance along track (or ping number), you really can’t use these slant-range images for accurate location or measurement of objects. However, if the height off the bottom (towfish altitude) is less than one quarter of the maximum slant range, they present reasonably undistorted images with minimal computational effort. Furthermore, they provide a clear indication of the bottom profile beneath the fish, which is quite useful in keeping the fish out of the mud (if the two sides were to close in and merge together, your water column would be zero, and you'd then be dredging, not surveying). While the echoes from objects in sidescan sonar images are sometimes fuzzy, the shadows are often quite crisp, as shown in Figure 6.
Brief History of Sonar Development (page 3 of 4)
Figure 5. Sidescan image with the center track and data from the port and starboard channels
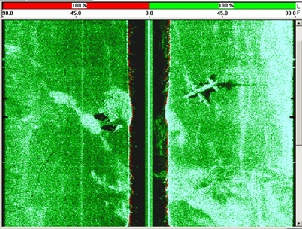
Figure 6. Sidescan image of two
submerged crafts taken by the SIS1000